

Weekend Rundown: Follow the reversal | Chart Crime | What's Rational
Weekend Rundown: Follow the reversal | Chart Crime | What's Rational

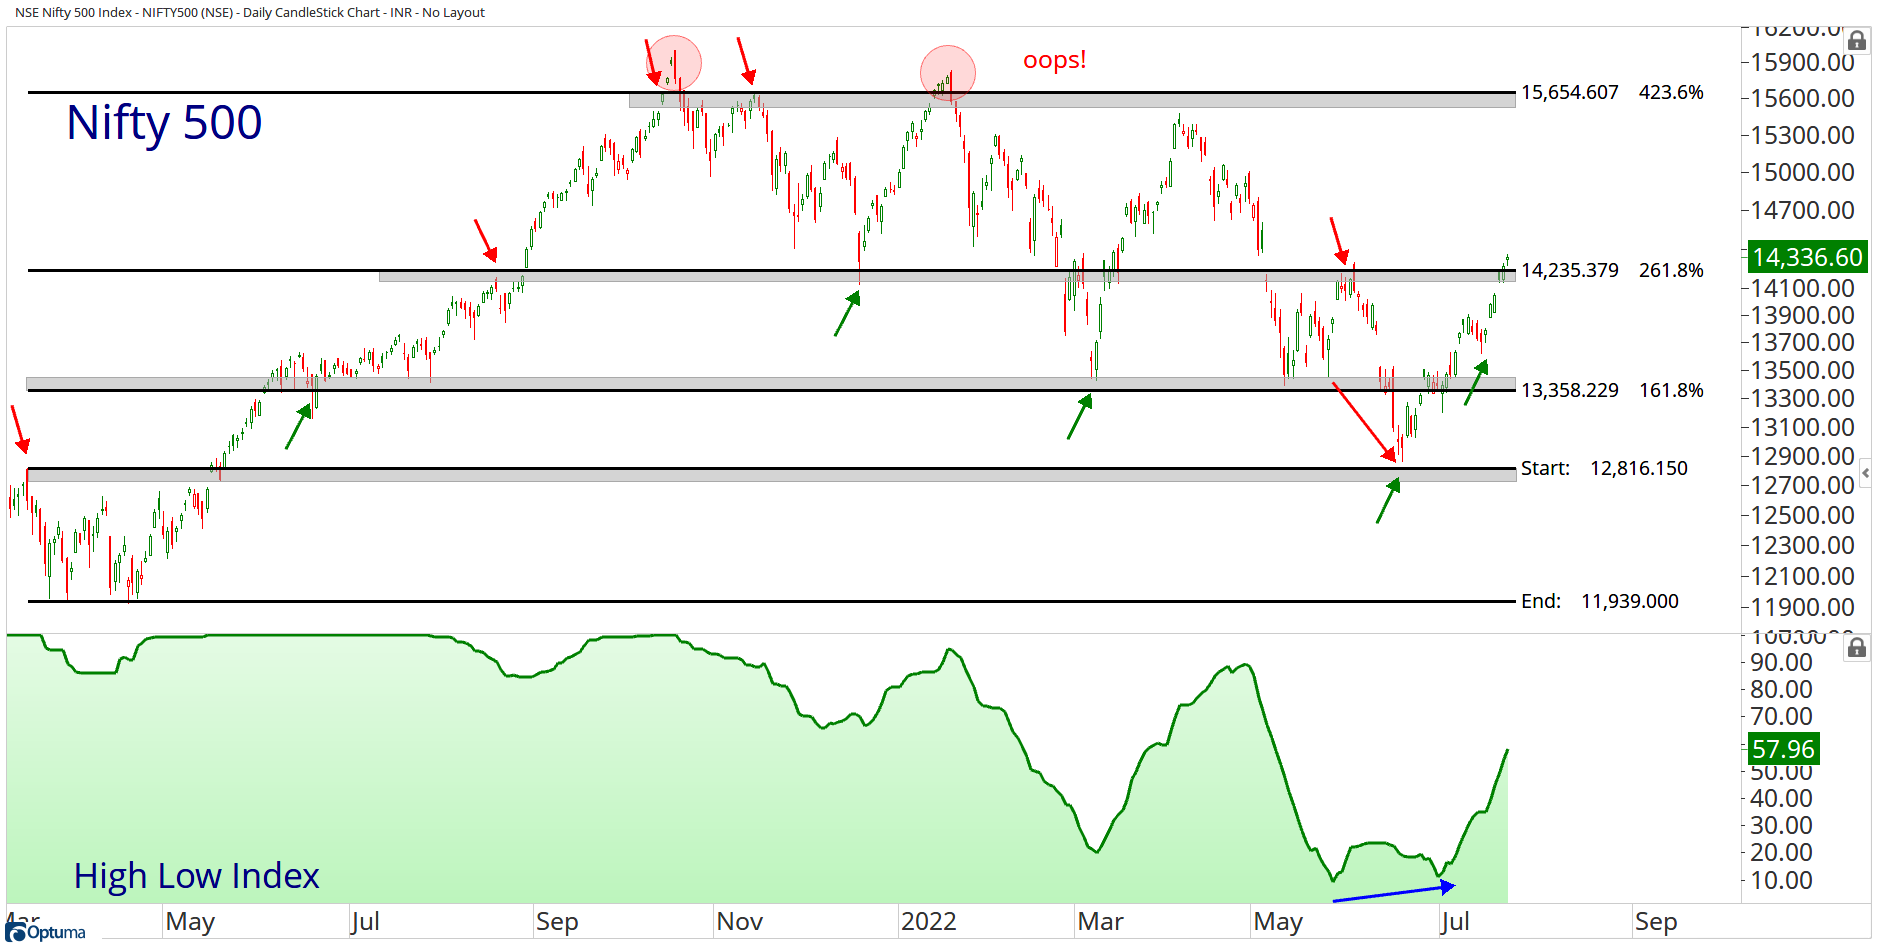
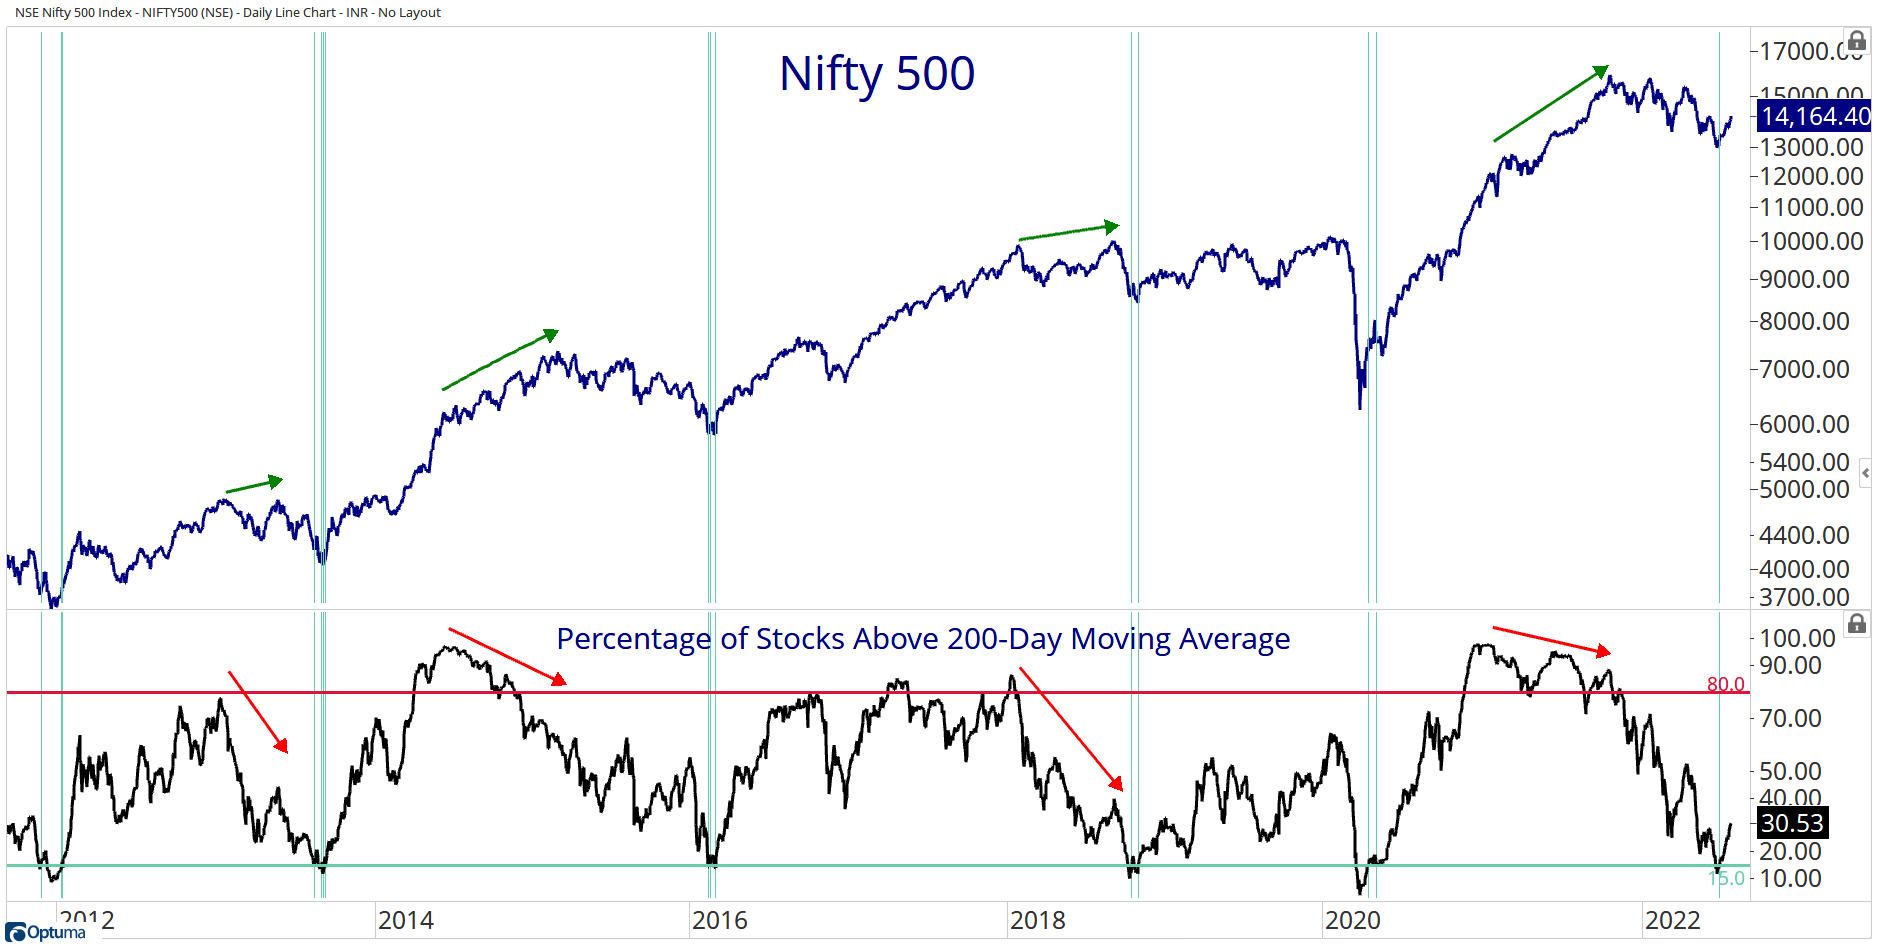
The market breadth continues to improve, with 33.6% of Nifty 500 stocks above the 200-day moving average and 77% of stocks above the 50-day moving average. The high low indicator shows that more stocks are making new highs. Nifty 500’s resistance is at 14,200. It would be the key level to watch how stocks react at this critical resistance level.
The current market reminded me of 2018 when Nifty Smallcap peaked in January, and there was a rotation among a few sectors and stocks. Although as of now, Nifty Microcap 250 stocks are better performers than Nifty Smallcap Stocks. So, the lowest segment market cap stocks are not doing that bad.

The number of Nifty 500 stocks above the 200-day moving average is the top chart that can be used to determine the market environment.
Currently, we are bouncing back from the point of extreme. It’s not that we’ll get a shape rally, but selective participation is on the clock. Like Auto and Capital Goods sector did well with more stock making new highs.
Last week we discussed the heuristics to find the reversal after a long decline. In summary, the price is above the short-term moving average(50DMA) and below the long period(200DMA).
Additionally, we can look at the ratio of the new high relative to the benchmark index before the absolute price makes a new 3/6/12 months high.
Here are a few interesting charts in that series:
LGBBROSLTD New relative high before price.
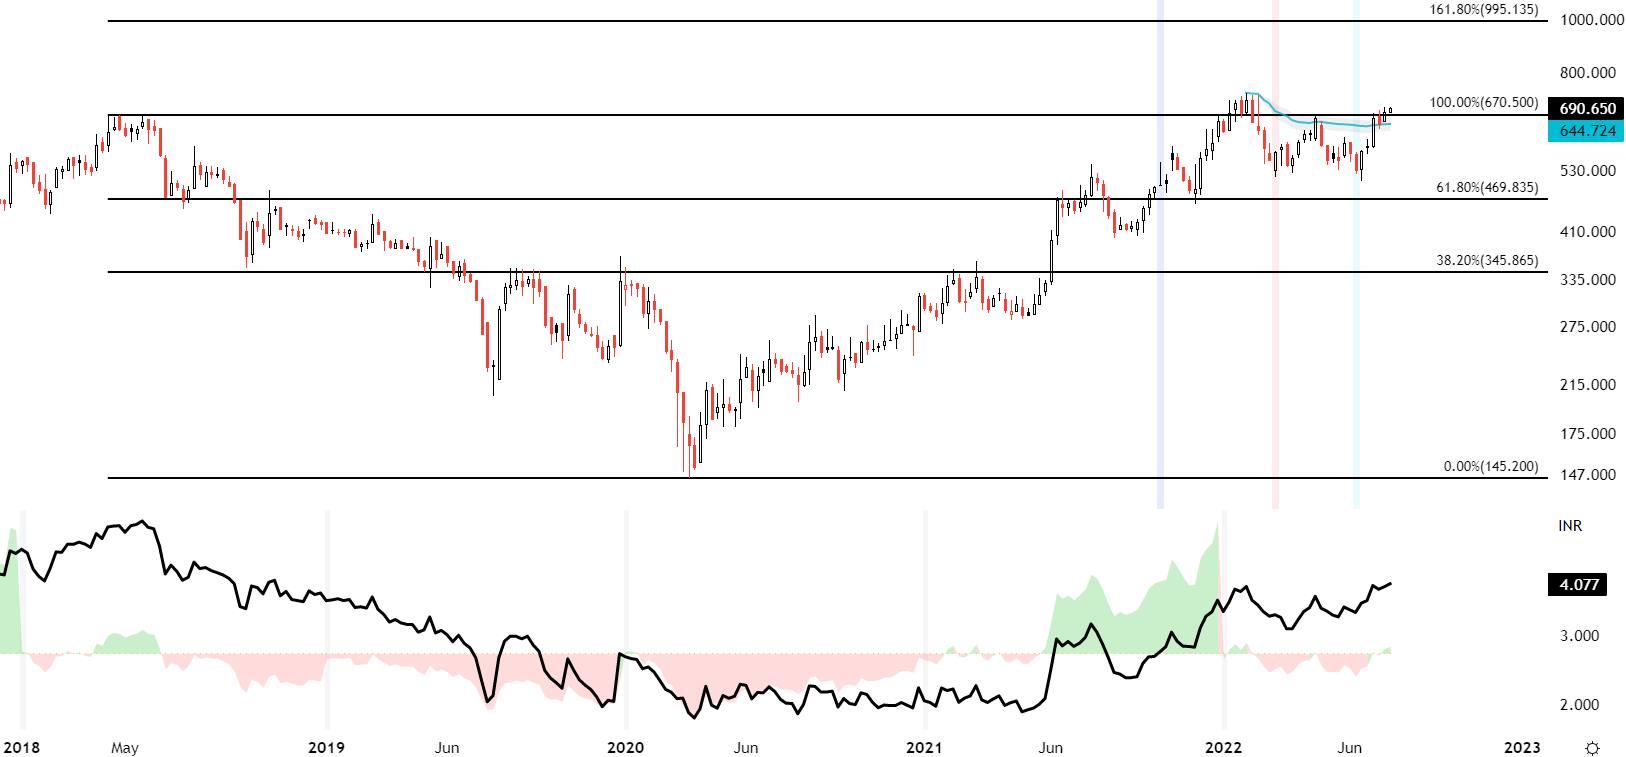
You say curve fitting; I say avwap from 52week highs.
BALKRISIND
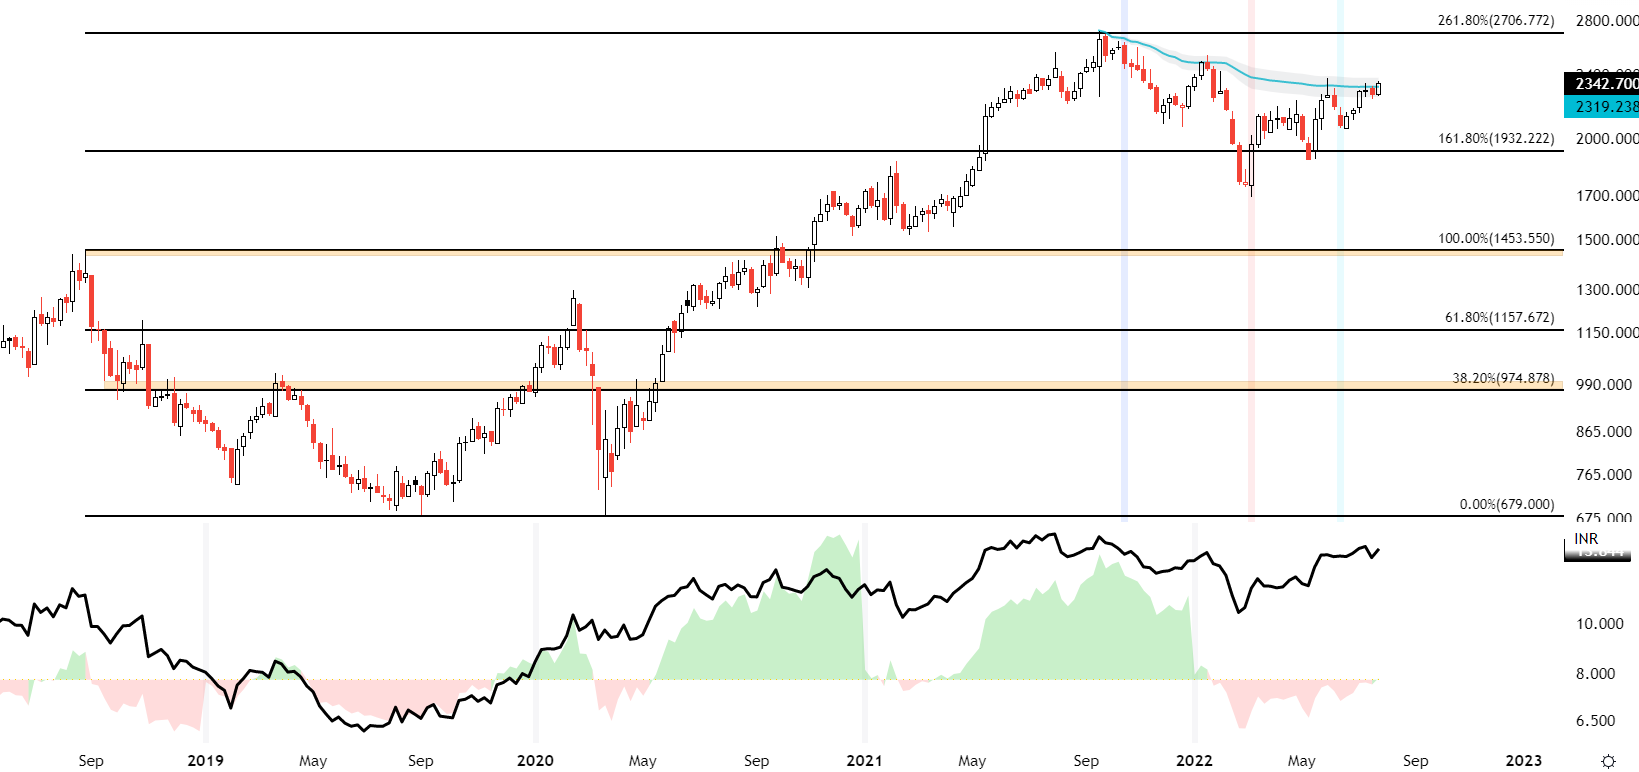
TATAMTRDVR
Presidential Chart Crime?
Data Virtualization is a tricky subject. Here we have two correlated data series. The line chart is forcing a relationship by cherry-picking the size of the y-axis, and overlap shows that one WTI is down much more compared to Retail gasoline.
If you look at the % term from June highs, the difference between Crude Future and Retail Gasoline Price is not that huge. While the fact is correct, WTI has a higher % drawdown from June high than retail gasoline. The absolute price scale isn’t the best way to represent this information.


What’s Rational
We often hear how a rational investor should behave. It’s advisable to look for fundamentals, Earnings, Cashflow or Intermarket/quantitative study of price.
We never have all the information required to make a decision. That doesn’t mean all actions are random, but they are more random than we think.
Historically, societies and religions have categorized what’s rational and what is not. The root of rationality comes from what survived. The form of behavior and action that survives the test of time becomes rational.
So, in markets, it boils down to survival. Survival = Risk management.
Buffet/Munger with fundament approach has a definitive rational behavior. It starts with not going where you can die (lose money) by limiting investment within the circle of competence.
Ed Thorp/ Nassim Taleb navigates markets with a price-based quantitative approach. By the following price, they manage risk, so that’s their way of rationality.