

Cement Sector: What to buy when you see the strength
Cement Sector: What to buy when you see the strength

- Overview
- Performance
- Individual Stock Setup
- When a sector shows strength, which stock to pick for LONG?
- Monthly Overview
⚠ Hindsight Bias Ahead
Overview
The cement sector has been showing strength lately in a weaker market. Cement is a cyclic sector, so timing is crucial here. We can look at strength buildup in an industry by looking at all constituent stocks. If the sector performs better than the broader market, it's better to buy them early than eventually.
Here's the custom index for NIFTY 500 cement sector stocks. It will give us an overview of the rate of change in all the stock.
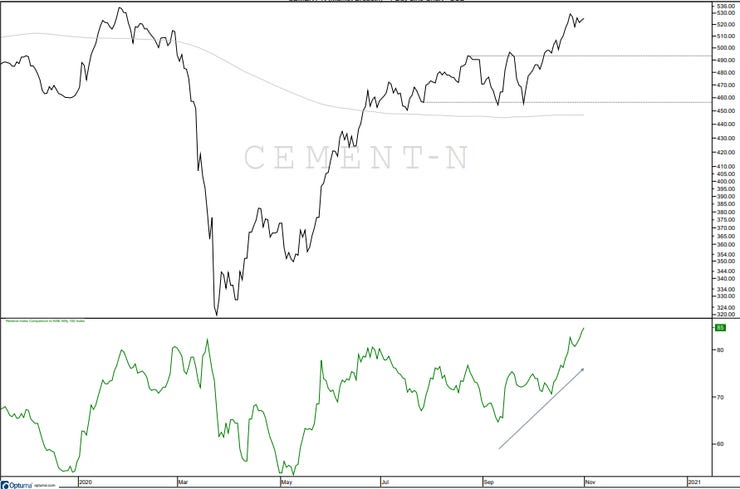
Geometric average Index of CEMENT Sector.
The sector index had a double bottom confirmation and breakout on 7th October 2020. We will take that as an anchor point for further study of this breakout.
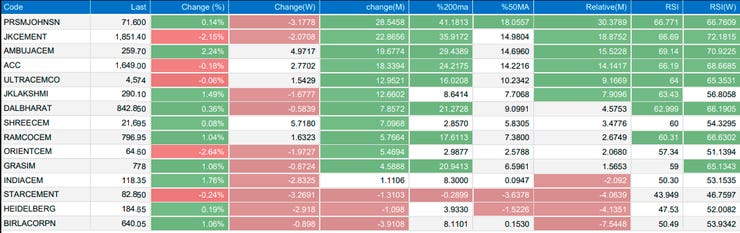
After the breakout, the index gained 5.99%, and the performance of the constituents is the following:
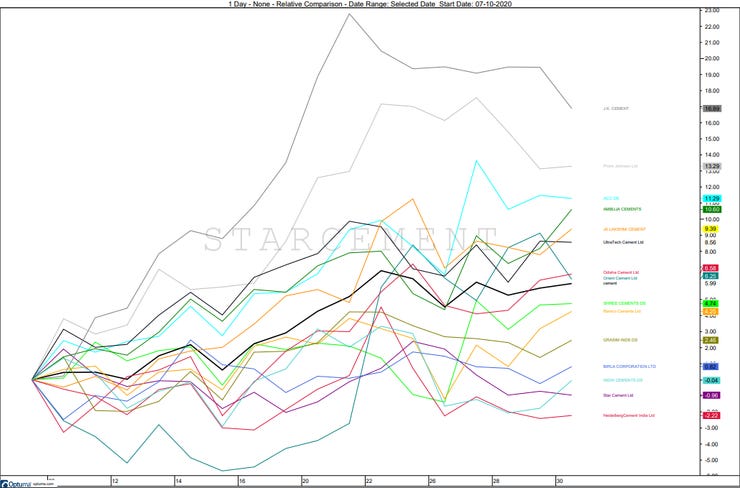
Performance: 07 Oct - 30 Oct '20
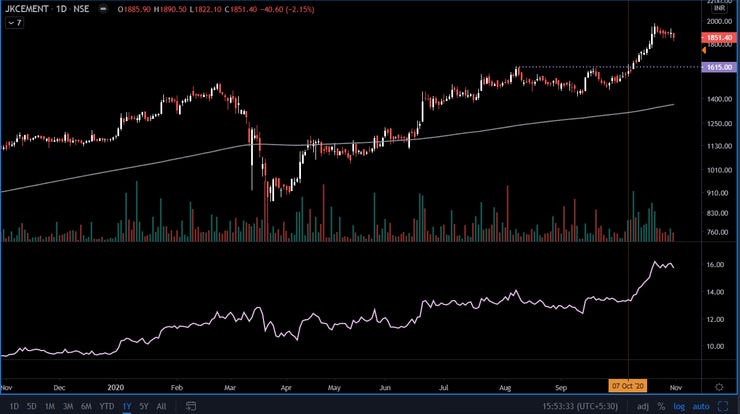
#JKCEMENT 16.89↗
Before Sectorial Breakout it was trading near an all-time high.
Outperforming on Absolute and relative basis.
200 Moving average sloping Up
Breakout with volume.
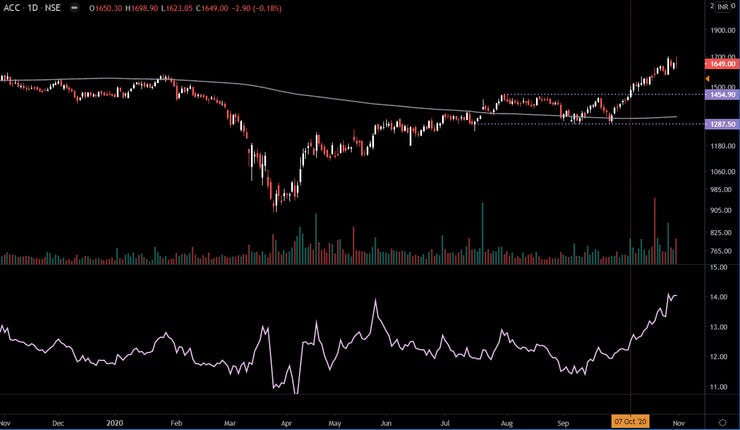
#ACC 11.29↗
Outperforming on one year Absolute and relative basis.
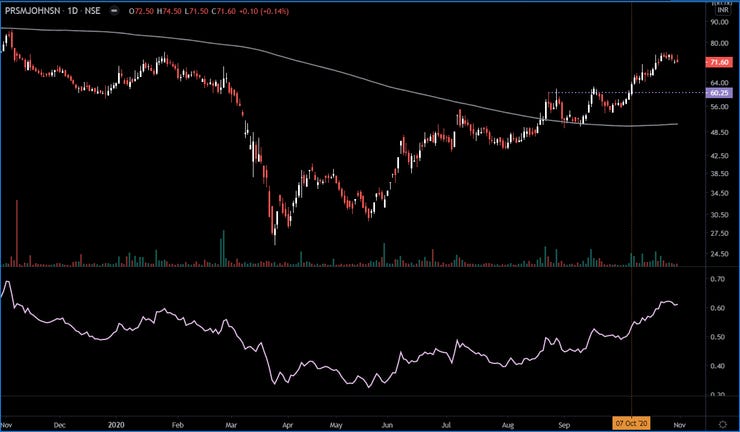
#PRSMJOHNSN 13.29↗
Is in good trend after March '20 correction.
Breakout was similar to the sectoral index.
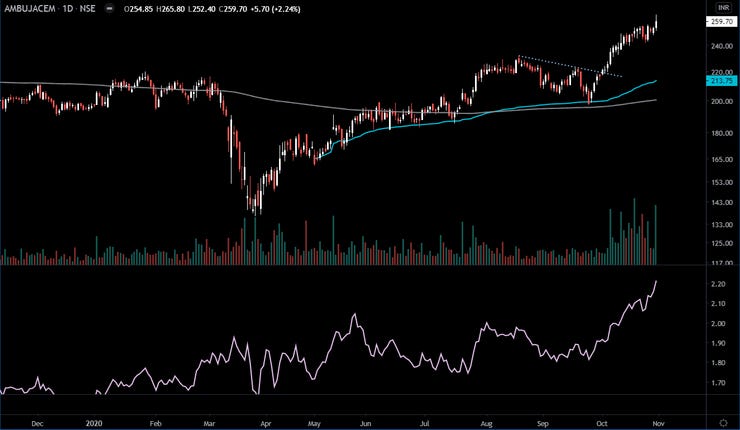
#AMBUJACEM 10.60 ↗
Outperforming on Absolute and relative basis.
Breakout on declining trendline with good volume.
200 MA turning up.
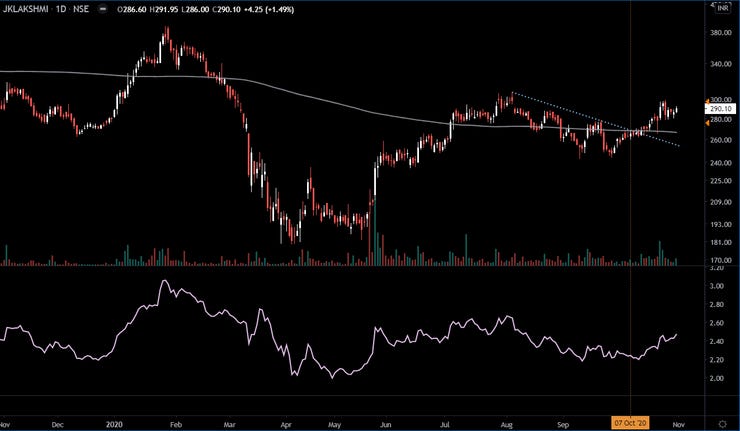
#JKLAKSHMI 9.39↗
Underperforming on Absolute and relative basis.
Flat 200 MA
Had breakout wrt index
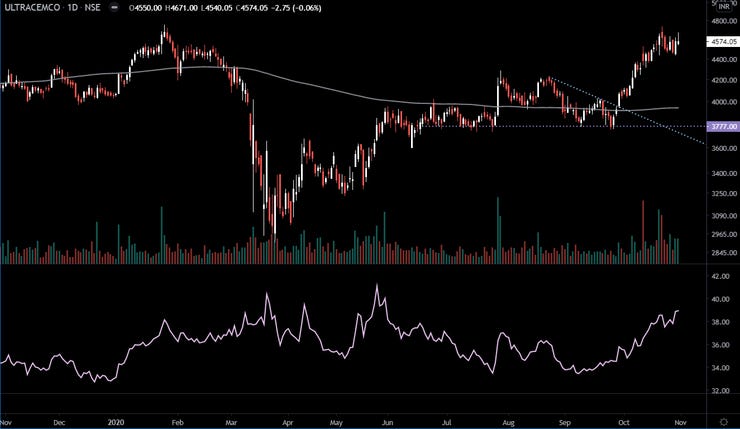
#ULTRACEMCO 8.56↗
Had breakout wrt index with incremental volume.
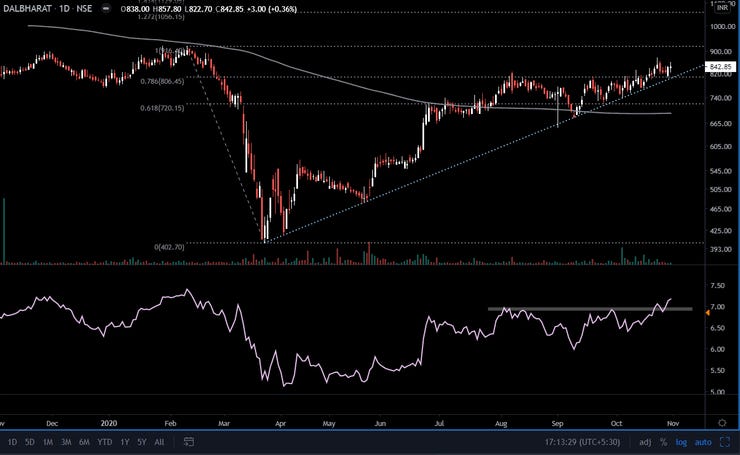
#DALBHARAT 6.58↗
Above 806 it'll get polarity support.
Following rising trendline from March '20 lows.
#ORIENTCEM 6.25
Weakness is clearly visible. Flat 200 MA with no clear trend.
Resistance from 0.618 Fibonacci level

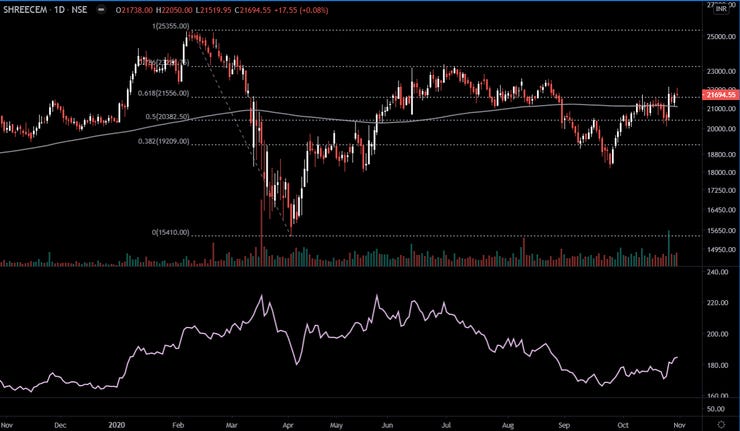
#SHREECEM 4.74
Underperforming on an Absolute and relative basis.
Resistance at 21556 (Fibonacci 0.618)
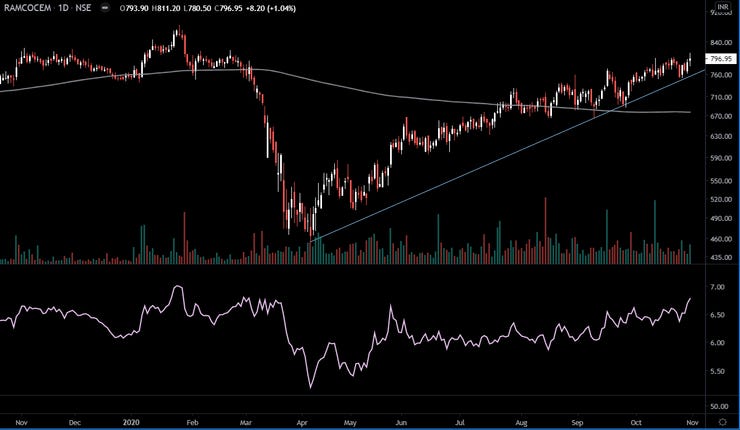
#RAMCOCEM 4.25
Rising trendline: Maintaining strength.
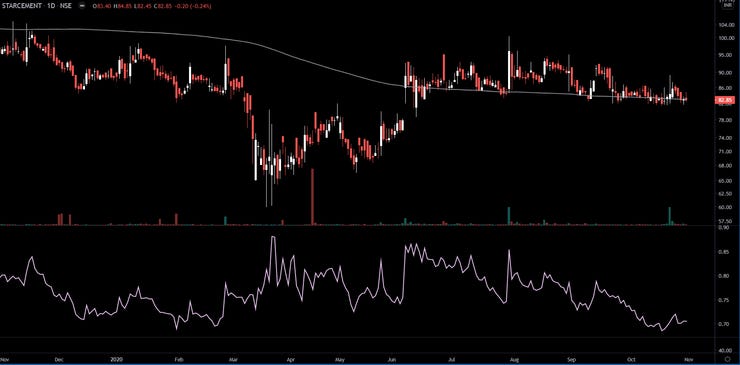
#STARCEMENT 0.96
Underperforming on an Absolute and relative basis.
Candlestick shows the sentiment, the chart clearly screaming: Stay Away
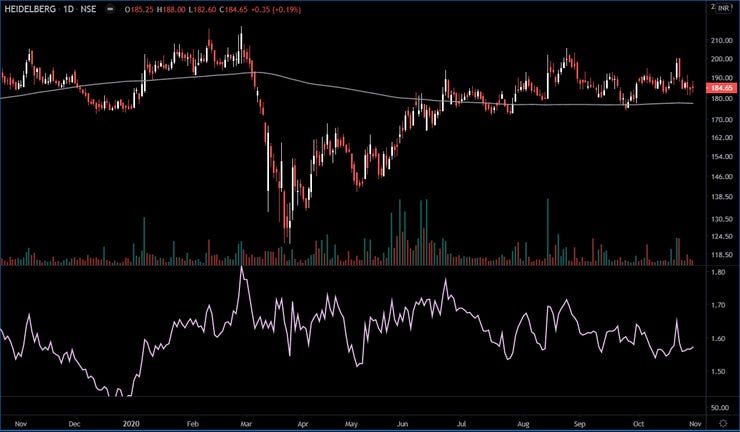
#HEIDELBERG 2.22
Underperforming on an Absolute and relative basis.
Flat 200 MA, No clear trend
You don't want to pick this to get benefit from sectorial strength.
When a sector shows strength, which stock to pick for LONG?
- Stock that has been outperforming the market/sector on a long-term basis.
- Trend confirmation using Dow Theory.
- Above long-term moving average (200 Simple Moving Average).
In this case, stocks above 2-month highs and Continuous relative strength against the market have performed well.
Overview: 26 Oct - 30 Oct '20
The stocks with strength are likely to get more benefits from continuous money flow in that sector compared to expecting a revival of weaker stocks.